Prepared By:
Grace Patterson, Research Associate, Centre of Excellence for Sustainable Food Systems
What is food insecurity and how is it measured?
Food insecurity (FI) is defined by the FAO as “a situation that exists when people lack secure access to sufficient amounts of safe and nutritious food for normal growth and development and an active and healthy life”. Food security spans four levels: food secure, mild FI, moderate FI, or severe FI.
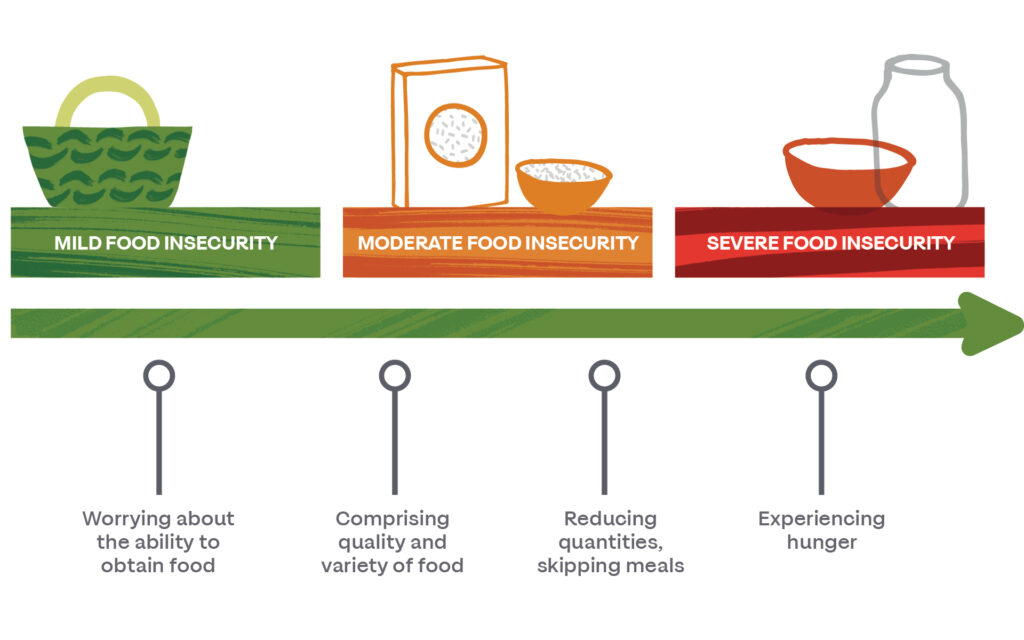
Food insecurity takes many forms and is often (but not always) related to hunger. Those experiencing food insecurity might have enough to eat but are not able to access the foods they prefer or need. Others might routinely experience an inability to purchase food at the end of each month year-round, while some only experience food insecurity in moments of unforeseen crisis, such as emergency bills or in between jobs. In some cases, children in the household might have enough to eat, but only because caregivers are going without. Therefore, it is difficult to define a “typical” case of food insecurity.
Typically measured at the household measure, there are several validated screeners that provide varying levels of detail on the type and extent of household food security. These include (among others) the nine-question Household Food Insecurity Access Scale (HFIAS)1, the simple Hunger Vital Sign two-question screener2, and multiple US Department of Agriculture Economic Research Service screening tools of various lengths and language designed for different situations3. These screeners ask questions about people’s worries related to purchasing or having enough food, as well as any times when they were unable to find food to eat.
In the UK, FI is not measured as a government statistic. Statistics such as food bank usage are often used as proxies but underestimate the true burden of FI4. The March 2021 Department of Work and Pension Family Resources Survey5 has, for the first time, provided some measure of household FI using ten questions from the USDA household FI screening tools. The report indicates that 13% of the population experienced FI (pre-COVID). However, more progress is needed to accurately capture the growing burden of FI in the UK. International groups, such as FAO and UNICEF, calculate nationwide estimates of FI in the UK and other countries. A recent UNICEF study6 found that 19.5% of children under the age of 15 lived with an adult experiencing moderate or severe FI. This statistic placed the UK among the bottom of European countries in terms of child food security.
What is the context of FI in Liverpool?
FI is commonly associated with specific living conditions, environments, or community groups, such as poverty, rural areas, or single-parent households. However, these associations may change with time and place. In Liverpool (as everywhere) a major driver of FI is economic distress. Liverpool is home to three of the ten most economically deprived food deserts (areas with poor access to food) in England, where poor food access and economic insufficiency intersect7. As data on FI is not directly collected in Liverpool, it is difficult to know exactly which populations are experiencing FI. Proxy metrics that indicate the level of FI among economically distressed groups include data on eligibility for and uptake of Free School Meals and Healthy Start Uptake and Universal Credit and jobless claims, however, these data are usually not given at a granular enough level for detailed analysis.
Other major groups in Liverpool that may struggle with FI include ethnic minorities and asylum seekers who struggle to access culturally acceptable foods, as well as those with disabilities, in long-term care, or shielding. These groups may also struggle for economic reasons but are also likely impacted by poor access, whether in terms of store availability or other access issues such as digital exclusion. COVID-19 has somewhat altered the demographics of foodbank use, with the need expanding and shifting as people’s living conditions and livelihoods were upended8. The long-term impact of the pandemic on patterns of food insecurity in the region remains to be seen as restrictions relax and societal (and personal) recovery unfolds.
Encouragingly, Liverpool has many assets in food provision and local food systems, including a strong emergency provision network, expanding associations of empowering community pantries, innovative social enterprises and food businesses, and swelling local interest in small food businesses and locally produced foods. Liverpool is geographically positioned in a region with a port that plays a role in food and agricultural product import and export. In the Liverpool local authority across 56 farm holdings, farmers are growing increasing numbers of livestock in the grasslands surrounding the city22. In the wider North West, these grasslands support livestock and dairy production, and farming employs approximately 40,000 people23. The tourist economy also supports many food-related jobs. Finally, there is strong organizational support and interest around food security in Liverpool, as evidenced by participation in the Right to Food Campaign, the End Hunger UK Campaign, and others.
How has FI changed in Liverpool over time?
From 2010-2020, trends of increasing life expectancy, decreasing mortality, and reductions in poverty across the UK slowed, and in some cases reversed9. While quality data on food insecurity levels over this time period is not available, other statistics such as child poverty and food bank usage can help paint a picture of the state of food security over time. In 2018, child poverty levels exceeded pre-2010 levels, at 30% (after housing costs). These numbers were over 40% for households with single parents, more than three children, or ethnic minorities. The number of those in work experiencing poverty has also increased in this time period, from 3 million in 2010 to 3.7 million in 2017. Rates of poverty are highest among people from ethnic minorities or with a disability, or both. The number of people on zero-hours contracts in the UK has also skyrocketed, from 168,000 people in 2010 to nearly 900,000 in 2018. The strength of support benefits has also decreased over this time, with tighter restrictions on accessing programmes like Healthy Start, and reductions in food welfare budgets. The number of Trussell Trust network food banks has exploded from 65 in 2011 to 1,200 in 2019.
This widening of social and health inequities has been particularly strong in the North, as well as among the most deprived 10% of neighborhoods. In Liverpool in 2019, 49% of all LSOAs fell among the 10% most deprived in England10 and have been among the most deprived local authorities for the past 15 years. Life expectancy at birth, overall health, and spending on social services have all worsened disproportionately in more deprived areas compared to less deprived areas, further exacerbating existing inequities9. In fact, funding cuts in UK cities and towns from 2010 to 2018 were the most extreme in Liverpool, where they equated to a decrease of £816 per resident per year. Together, these statistics suggest that food insecurity has also likely increased in Liverpool over the last 10 years, especially among those living in areas of high deprivation.
Health and Wellbeing Impacts of FI
FI is associated with poor health outcomes such as malnutrition, obesity, nutrition-related non-communicable diseases, and depression11,12. Liverpool experiences significantly worse health outcomes than the England average, many of which are frequently related to FI or poor diet. A summary of the Liverpool Local Authority Health Profile shows that the region experiences worse rates of cardiovascular mortality, cancer mortality, adult and child obesity, and long-term disability than the England average (but comparable or lower levels of hypertension and diabetes)13.
FI impacts people of all ages and has intergenerational effects. Even moderate FI can impact child development14, future educational and economic attainment15, mental health16, and socialisation and wellbeing12,17, in turn contributing to wider socioeconomic and health disparities as they grow into adulthood. Food-based coping skills and unhealthy food behaviours formed in the context of childhood FI usually persist into adulthood18. Adults experiencing FI often also experience stress and anxiety, particularly if they are concerned about providing for other family members, and rely on unhealthy food-based coping habits19. In highly developed countries such as the UK, FI is associated with obesity, vitamin deficiencies, and increased chronic disease due to increased reliance on processed foods, inability to access healthy diets, and changes in metabolism associated with inadequate nutrition20. Seniors with FI can also experience poorer mental health, reduced nutrient intake, and limitations in completing daily activities11. FI, therefore, has the potential to impact people of any age, in multiple facets of their life.
Evidence for Reducing FI
There are many programs in place with the aim to reduce FI across different vulnerable groups and through the actions of different organizations in society. However, evidence supporting the effectiveness of these interventions is often lacking or anecdotal. Reliable quantitative and qualitative data on the effectiveness of interventions can be useful to win support and funding for the expansion of interventions, to identify unintended effects of the intervention (positive or negative), and to increase the efficiency and effectiveness of the program.
Economic constraints are among the most commonly reported barriers to consuming a healthy diet. Many other issues stem from economic issues, such as access to transportation, shops, proper cooking appliances, and implements. While most people know what a healthy diet looks like, many fail to achieve it due to lack of access, perceived inconvenience, or lack of sufficient motivation. The modern food environment is saturated with advertisements and promotions heavily skewed towards the consumption of foods high in salt, sugar, and/or fat overconsumption of minimally processed, whole foods. Therefore, actions that target personal behavior change (such as educational campaigns) are relatively ineffective if carried out in absence of increased economic support and changes to the environment in which dietary choices are made. Methods to address this environmental component include bans on advertising to children or increasing access to affordable produce in underserved regions. Finally, consideration must be given to the idea of food as a means of connecting with others, creative expression, a celebration of culture, and autonomy. Long-term solutions for healthy eating require building knowledge, skills, and behaviors in a safe environment and empowering people to experiment with food and take ownership of their dietary choices.
Overall, data on the effectiveness of interventions against FI is lacking in the UK compared to countries such as Australia, Canada, and the US. However, we can assume that the many similarities between these countries will often allow for the extrapolation of their findings to the UK. The Centre for Food Policy at City, University London has recently compiled a list of 42 actions across agriculture, international trade, research, supply chains, finance, education, regulation, and more that are evidence-backed and have a strong chance to reduce FI21. During the development of the Good Food Plan, we have produced a similar, but more focused catalogue of actions to be taken at the local level to reduce FI in Liverpool, including short-term “band-aid” actions and more long-term, strategic actions. Detail on the specifics of different interventions can be found in the document.
Measuring Impact
As previously discussed, FI is poorly measured and described in Liverpool (and the UK). To monitor the impact of interventions going forward, it is imperative that we can routinely measure food insecurity at a population level (less frequently) and in key/accessible demographics (more frequently). Good data infrastructure is critical for rapid identification of and response to spikes of food insecurity, as well as long term planning and management. This will require collaboration between different data collection agencies and development of data sharing and management protocols. The newly developed Liverpool Civic Data Collective may be able to help make this a reality.
Short-term steps to improve FI monitoring in Liverpool include identifying proxies that are collected at a spatially fine enough level to be helpful, finding data that is collected routinely enough to be helpful, and finding data that is shareable. Beyond measuring FI directly, there are many proxies and indicators of FI and related risk factors that can be monitored to give a glimpse of the state of FI in Liverpool and measure any progress over time (see spreadsheet). These span health, jobs, economics, household composition, etc. Care must be given to identify proxies that match expected rate of change from the intervention and are collected at logical timepoints. When launching new interventions, thought should be given to developing a data collection plan alongside the intervention to ensure data on implementation and effectiveness will be collected. Longer term, plans should be developed to routinely sample for FI in the city using existing community connections and employing a validated screener. Measuring the problem of FI is integral to developing effective plans to defeat it, and to inspiring others to persist in the effort year after year.
References
1 Coates J, Swindale A, Bilinsky P. Household Food Insecurity Access Scale (HFIAS) for measurement of food access: Indicator Guide (v. 3). Washington, DC, 2007 https://www.fantaproject.org/sites/default/files/resources/HFIAS_ENG_v3_Aug07.pdf.
2 Hager ER, Quigg AM, Black MM, et al. Development and validity of a 2-item screen to identify families at risk for food insecurity. Pediatrics 2010; 126. DOI:10.1542/peds.2009-3146.
3 USDA ERS. Food Security in the US: Survey Tools. 2020. https://www.ers.usda.gov/topics/food-nutrition-assistance/food-security-in-the-us/survey-tools.aspx#household.
4 University of Oxford, The Food Foundation, Sustain. Measuring household food insecurity in the UK and why we MUST do it: 4 facts you should know. London, 2016.
5 Department for Work and Pensions. National Statistics: Family Resources Survey: financial year 2019 to 2020. 2021 https://www.gov.uk/government/statistics/family-resources-survey-financial-year-2019-to-2020/family-resources-survey-financial-year-2019-to-2020.
6 Pereira AL, Handa S, G. Holmqvist. Prevalence and Correlates of Food Insecurity among Children across the Globe. Florence, 2017 https://www.unicef-irc.org/publications/pdf/IWP_2017_09.pdf.
7 Kellog, Social Market Foundation. Can everyone access affordable, nutritious food ? 2018.
8 Loopstra R. Vulnerability to food insecurity since the COVID-19 lockdown: Preliminary report. 2020 https://ukdataservice.ac.uk/.%0Ahttps://foodfoundation.org.uk/wp-content/uploads/2020/04/Report_COVID19FoodInsecurity-final.pdf.
9 Marmot M, Allen J, Boyce T, et al. Health Equity In England: The Marmot Review 10 Years On. London, 2020.
10 Liverpool City Council. The Index of Multiple Deprivation 2019: A Liverpool Analysis. Liverpool, 2020. https://www.gov.uk/government/statistics/english-indices-of-deprivation-2019.
11 Gundersen C, Ziliak JP. Food insecurity and health outcomes. Health Aff 2015; 34: 1830–9.
12 McIntyre L, Williams JVA, Lavorato DH, Patten S. Depression and suicide ideation in late adolescence and early adulthood are an outcome of child hunger. J Affect Disord 2013. DOI:10.1016/j.jad.2012.11.029.
13 PHE. Public Health Profiles. 2019. https://fingertips.phe.org.uk.
14 Aceves-Martins M, Cruickshank M, Fraser C, Brazzelli M. Child food insecurity in the UK: a rapid review. Public Heal Res 2018; 6: 1–162.
15 Howard LL. Does food insecurity at home affect non-cognitive performance at school? A longitudinal analysis of elementary student classroom behavior. Econ Educ Rev 2011; 30: 157–76.
16 Heflin C, Kukla-Acevedo S, Darolia R. Adolescent food insecurity and risky behaviors and mental health during the transition to adulthood. Child Youth Serv Rev 2019; 105. DOI:10.1016/j.childyouth.2019.104416.
17 Ashiabi GS, O’Neal KK. A framework for understanding the association between food insecurity and children’s developmental outcomes. Child Dev Perspect 2008; 2: 71–7.
18 Scaglioni S, De Cosmi V, Ciappolino V, Parazzini F, Brambilla P, Agostoni C. Factors influencing children’s eating behaviours. Nutrients 2018; 10. DOI:10.3390/nu10060706.
19 Puddephatt J-A, Keenan GS, Fielden A, Reaves DL, Halford JCG, Hardman CA. ‘Eating to survive’: A qualitative analysis of factors influencing food choice and eating behaviour in a food-insecure population. Appetite 2020; 147: 104547.
20 Castillo DC, Ramsey NLM, Yu SSK, Ricks M, Courville AB, Sumner AE. Inconsistent Access to Food and Cardiometabolic Disease: The Effect of Food Insecurity. Curr Cardiovasc Risk Rep 2012; 6: 245–50.
21 Hawkes C, Walton S, Haddad L, Fanzo J. 42 Policies and Actions To Orient Food Systems Towards Healthier Diets for All. Centre for Food Policy Research. 2020; https://www.gainhealth.org/sites/default/files/event/publication-42-policies-and-actions-to-orient-food-systems-towards-healthier-diets-for-all.pdf
22 Defra. Structure of the agricultural industry in England and the UK at June. April 2021. https://www.gov.uk/government/statistical-data-sets/structure-of-the-agricultural-industry-in-england-and-the-uk-at-june . Accessed July 8, 2021
23 National Farmer’s Union: North West Office. Back British farmers in the North West. https://www.nfuonline.com/about-us/our-offices/north-west/north-west-key-content/back-british-farmers-in-the-north-west/ . Accessed July 8, 2021.